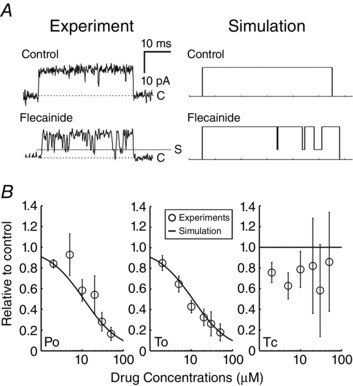
Figure 3. Simulated interaction of flecainide with single ryanodine receptors .

A, experimental single RyR channels in bilayers (left) compared with stochastic model simulations (right), in the absence (top) and presence (bottom) of 50 μM flecainide. B, measured and simulated dose dependence of flecainide on channel open probability (P o, left), mean open time (middle, T o), and mean closed time (T c). Experimental data points (circles) and simulated results from ∼1,000,000 stochastic openings and closures at concentrations as indicated (lines). Experimental data are from Hilliard et al. (2010 and Hwang et al. (2011).
