
Figure 5. Atomic scale prediction of flecainide transport across the membrane .
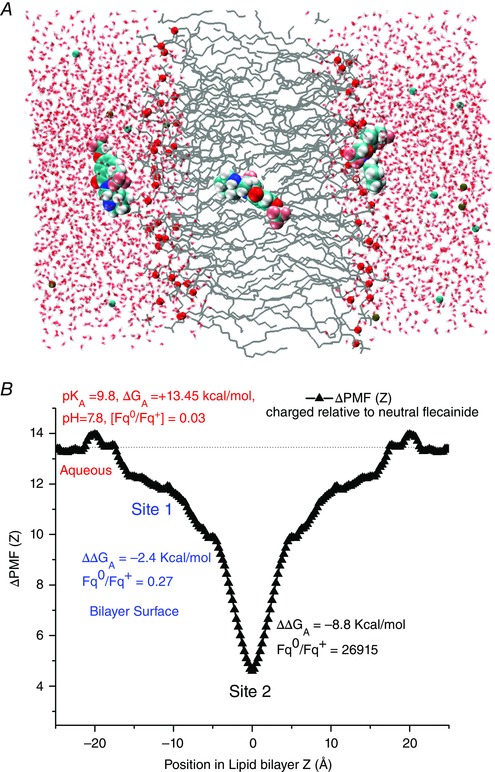
A, visualization of flecainide transport. B, the difference between the potentials of mean force (ΔPMF (Z)) across the bilayer, and position‐dependent free energies for charged and neutral flecainide (ΔΔG A) at the membrane interface (site 1) and hydrophobic core of the bilayer (site 2). Relative fractions of neutral to charged drug (Fqo/Fq+) in the aqueous solution (red), site 1 (blue) and site 2 (black) are shown.