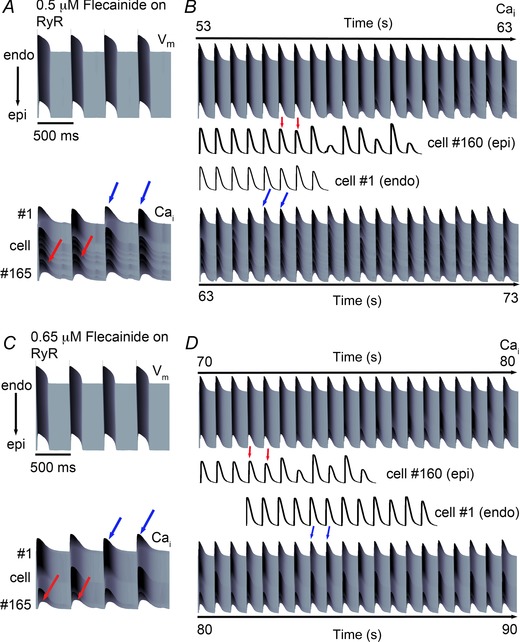
Figure 10. Simulated effects of low clinical dose flecainide effect on RyR only in CPVT one‐dimensional tissue .

Ca2+ alternans developed slowly over time, originating from the epicardial end (red arrows) and continued to the endocardium (blue arrows). A, simulated effects of low clinically relevant dose of 0.5 μM flecainide acting on the RyR alone on action potentials (top) and Ca2+ transients (bottom). B, spatially discordant Ca2+ alternans emerge over time. Red arrows correspond to epicardial (Epi) Ca2+ alternans, while blue arrows correspond to endocardial (Endo) Ca2+ alternans. Cell no. 160 (Epi) is shown from the time 53 s (bottom), and Cell no. 1 (Endo) is shown from the time 63 s (top). C, a modest increase in flecainide (0.65 μM) decreased the transient amplitude difference between beats and prolonged the onset of alternans. D, extended time course of Ca2+ alternans development for 0.65 μM flecainide on the RyR alone. Cell no. 160 (Epi) is shown from the time 70 s (bottom), and Cell no. 1 (Endo) is shown from the time 80 s (top). In panels B and D, arrows mark the first instance of alternans, which persist for the duration of the simulation.
