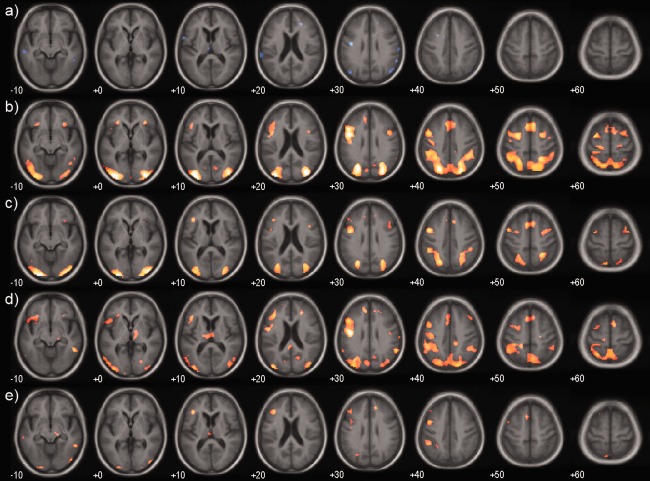
Figure 4.

Conflict effect. Mean group activations and group contrasts during the contrast hard – easy congruent target. (a) Controls, (b) Alzheimer's disease, (c) LBD, (d) AD – Control, (e) LBD – Control. Significantly activated voxels (P < 0.001 uncorrected) are overlaid on an age matched template in MNI space. Colour overlay is T statistic from −6 (blue) to +6 (yellow). [Color figure can be viewed in the online issue, which is available at http://wileyonlinelibrary.com.]
