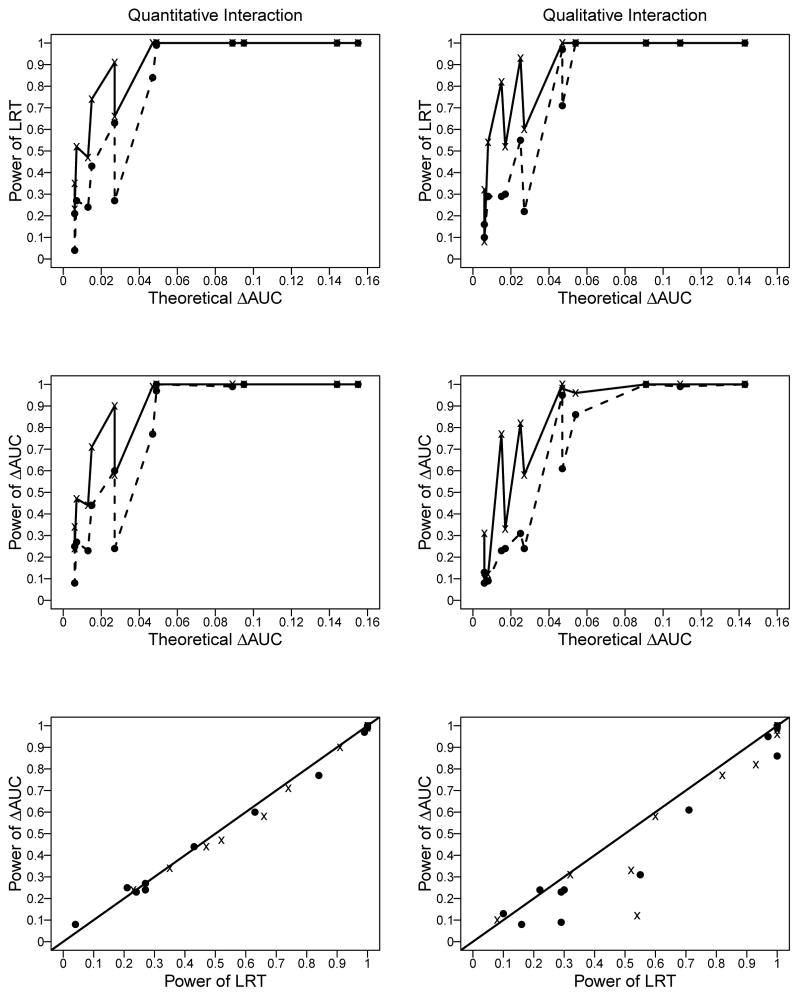
Figure 1.
Power of the likelihood ratio test (LRT; top row) and the resampling-based ΔAUC test (middle row), and a comparison of the powers of these two tests with the 45-degree line shown as a benchmark (bottom row). The left and right columns correspond to results for data simulated based on quantitative and qualitative interactions, respectively. These results are shown for sample sizes of 500 cases and 500 controls (bold lines in the top and middle rows with points in all the panels shown as “x”) and 200 cases and 200 controls (dashed lines in the top and middle rows with points in all the panels shown as a closed circle)

