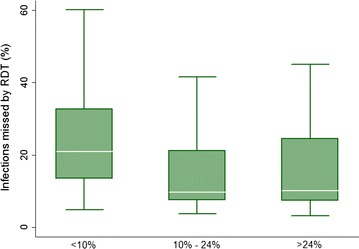
Fig. 4.

Prevalence of subpatent infections. The percentage of simulated infections in the population with parasitaemia of fewer than 100 parasites per microlitre, the simulated detection limit of the RDT used in the MTAT campaign. White lines represent the simulated median value, green boxes represent the inter-quartile range, and capped bars represent the upper and lower adjacent values for simulated results using an ensemble of 14 model variants and three random seeds for populations in each category of mean parasite prevalence
