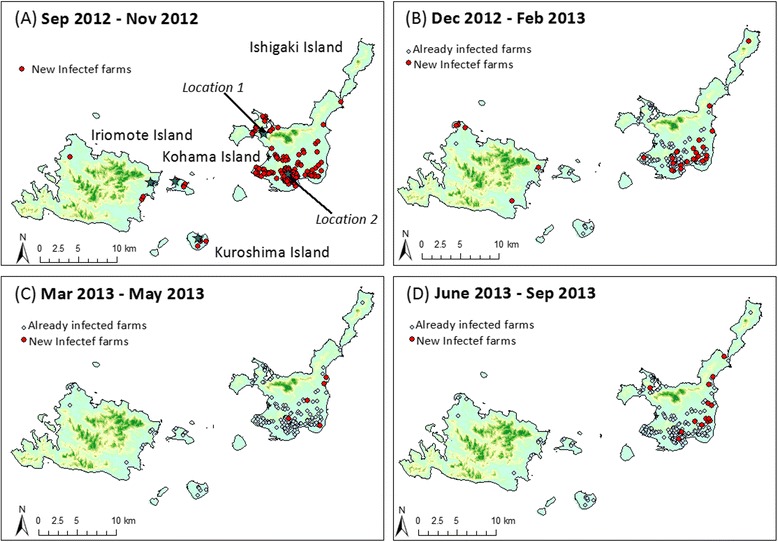
Fig. 1.

Distribution of infected farms in the Yaeyama Islands during the BEF outbreak in 2012–2013. The blue stars indicate the first case of BEF on each island and the starting points of the trajectory (on Location 1 and Location 2). The red dots show new infected farms during the period September 2012 to November 2012 (a), December 2012 to February 2013 (b), March 2013 to May 2013 (c), and June 2013 to September 2013 (d)
