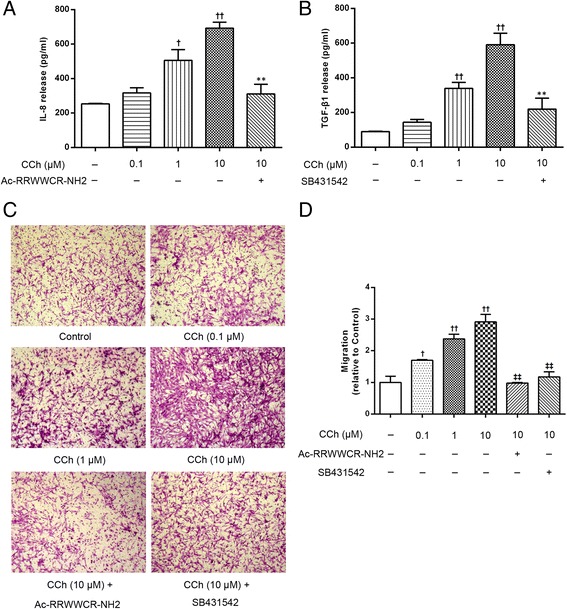
Fig. 3.

The carbachol-stimulated A549 cells induced IL-8 and TGF-β1 release and ASM cell migration. The A549 cells were stimulated with carbachol (CCh, 0.1, 1, 10 μM) in the presence or absence of the IL-8 inhibitor Ac-RRWWCR-NH2 and the TGF-β1 inhibitor SB431542 for 72 h. Then, the supernatants were collected and the IL-8 (a) and TGF-β1 (b) concentrations were determined using an ELISA. ASM cell migration initiated by the stimulated A549 cells was detected after 6 h of co-culture in the transwell system, the migrated ASM cells were stained with crystal violet (c, ×100). A quantitative analysis of migration used Image Pro Plus 6.0 (d). The values are expressed as the means ± SEM, n = 5–8. † p < 0.05 and †† p < 0.01 vs the control group, ** p < 0.01 vs the CCh (10 μM) group, ‡‡ p < 0.01 vs the CCh (10 μM) group
