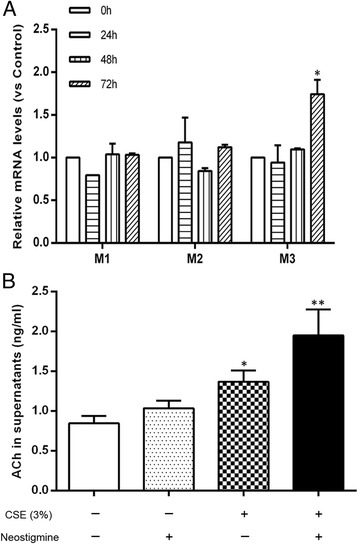
Fig. 5.

Effects of the CSE on acetylcholine release and the mRNA levels of M1, M2, M3. a Neostigmine (10 μM) was added to the A549 cells 1 h before stimulation with 3 % CSE. The acetylcholine (ACh) levels were determined after 72 h co-culture using an LC-MS/MS assay. b The A549 cells were incubated with 3 % CSE for 24, 48, 72 h, and the mRNA levels were determined using a quantitative RT-PCR and standardized to that of the GAPDH gene. The values are expressed as the means ± SEM. n = 3-5. * p < 0.05 and ** p < 0.01 vs the control group
