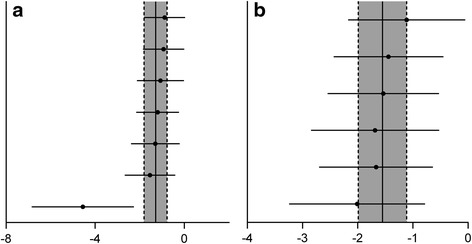
Fig. 5.

Meta-analysis of effect of TCMCR on the reduction of TNF-α(a) and NO(b). The horizontal lines represent the mean estimated effect size and the 95 % confidence intervals(CI) for each individual comparison according to their effect on TNF-α(a) and NO (b). The SMD and the 95 % CI of the global estimate are represented as solid and dashed vertical lines, respectively
