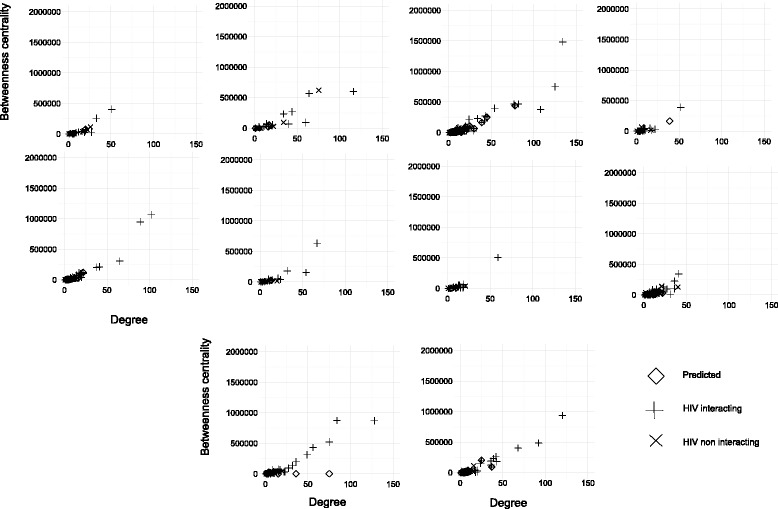
Fig. 7.

Scatter diagram for 10 selected meta modules showing the degree versus betweenness centrality of HIV-1 interacting proteins, HIV-1 non-interacting proteins, and the proteins that are predicted to interact with HIV-1 proteins. The three categories of proteins are represented by three separate markers
