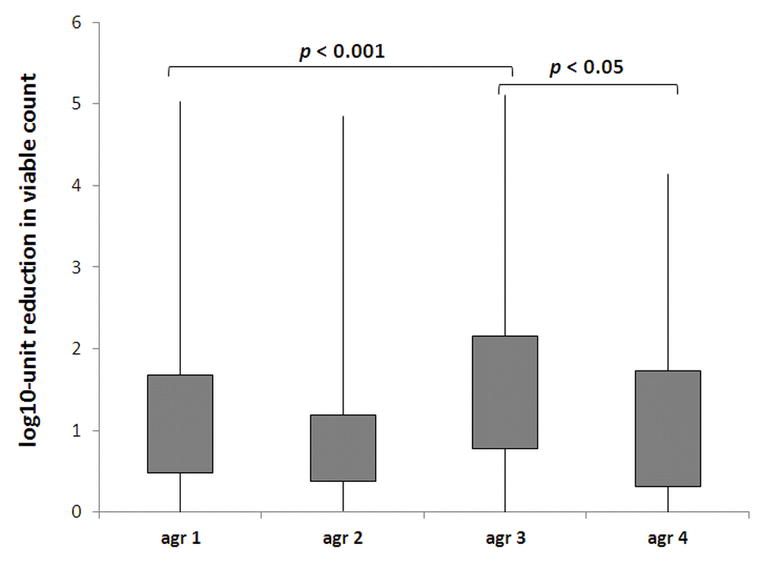
Fig. 3. Response of S. aureus strains differing in agr groups to PPIX-mediated PDI.

Each box plot represents the spread of bacterial response across the different clinical isolates. The error bars represent minimum and maximum value of log10-unit reduction in viable counts.
