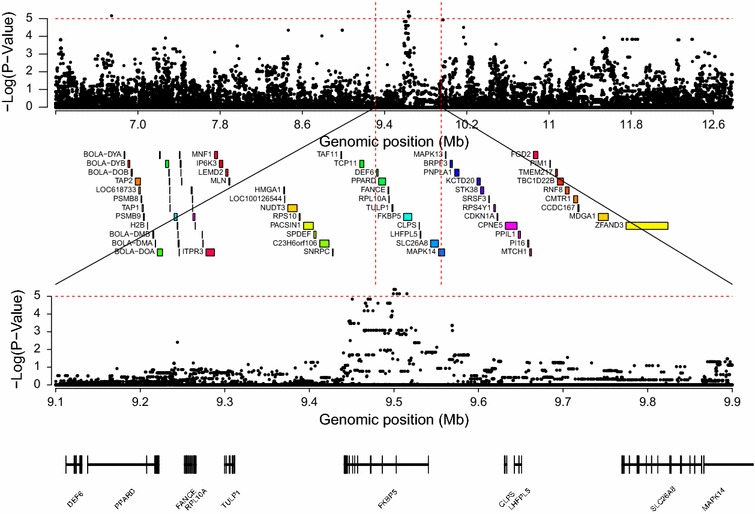
Fig. 3.

Manhattan plot of associations between SNPs and bTB susceptibility within regions on BTA23. Manhattan plot of associations between each SNP and bTB susceptibility identified within a 5 Mb (top) and 1 Mb (bottom) region on BTA23 imputed to full sequence using the single-SNP regression analysis with annotated genes indicated under the plot. Genome-wide significance level is indicated by the red dashed line
