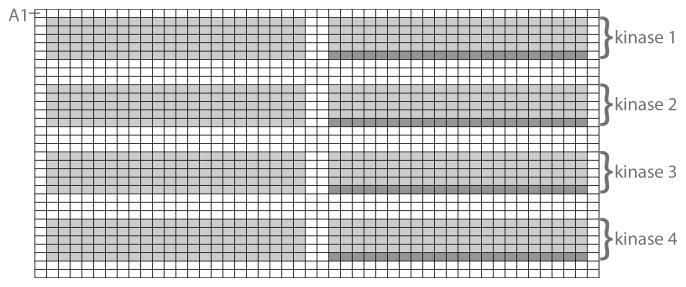
Fig. 1.
Up to four kinases can be profiled per 1536-well plate. The light gray boxes represent wells in which peptide (laid out as in Fig. 3) and kinase are present, the dark gray represent wells in which only kinase/ATP are present and are used as background controls.

