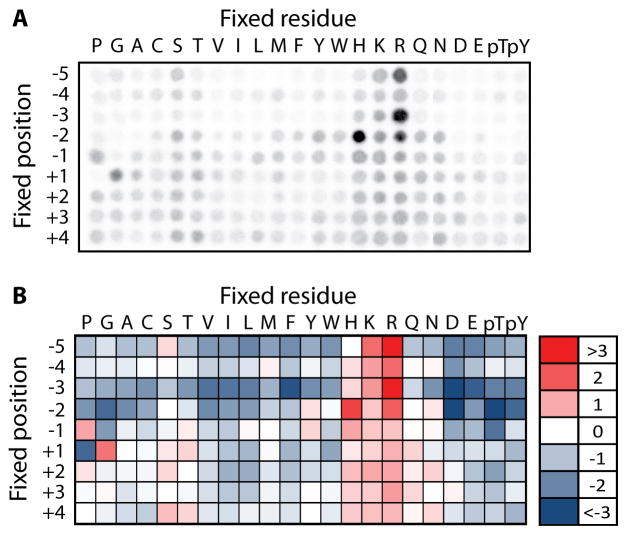
Fig. 4.
Representative results from PSPL assay. (A) Raw autoradiogram showing array of radioactive spots for the kinase Pim3. Spots arising from wells on the left and right sides of the plate, respectively, were arranged using Adobe Photoshop so that the peptide positions are presented in ascending order. (B) Normalized spot intensities from panel A were converted into a heat map showing positively (red) and negatively (blue) selected residues at each position.

