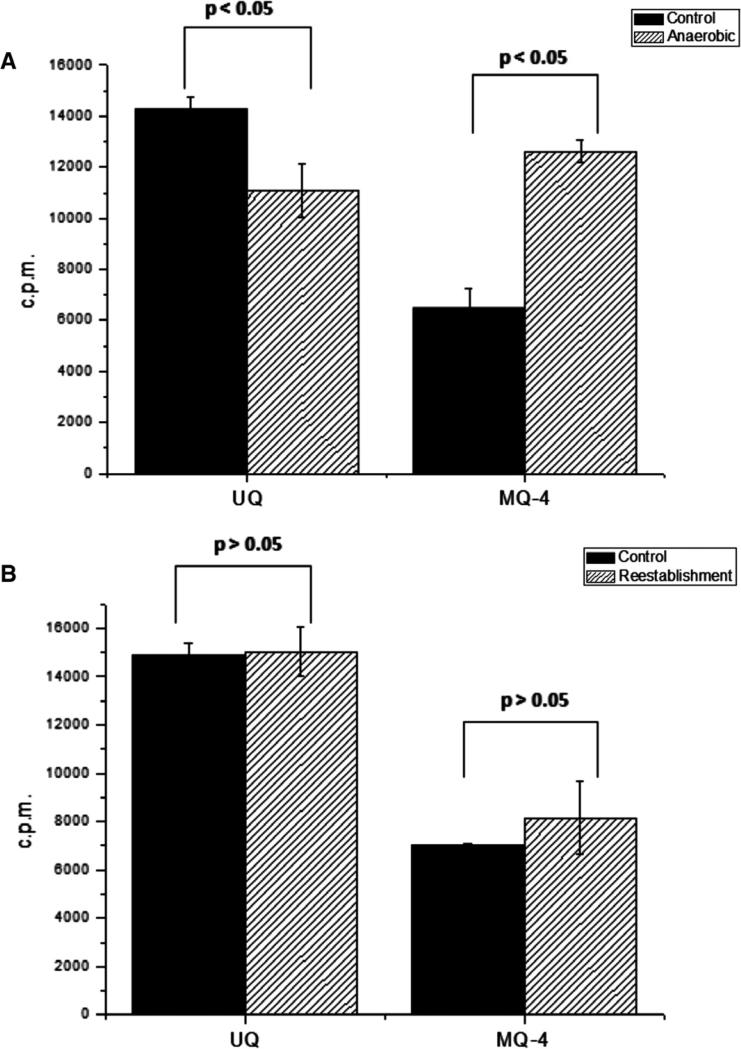
Fig. 5.
Menaquinone and ubiquinone levels change in response to oxygen supply. (A) The MQ and UQ extracted by the methodology described by Bekker et al. [18]) from 1 × 10⁹ [1-(n)-3H]GGPP labelled schizonts stages cultivated for 48 h in anaerobic or normal conditions were analyzed by HPLC (Protocol II). The radioactive peaks corresponding to the retention time of UQ and MQ-4 were plotted. (B) Levels of MQ-4 and UQ from parasites upon reestablishment of normal conditions for 48 h after 48 h under anaerobic conditions, compared to parasites maintained in normal conditions (n = 3 experiments). Significant differences in different oxygen-containing atmospheres (One-way ANOVA test P values indicated). Control: (5% O2, 5% CO2 and 90% N2); anaerobic: (5% CO2 and 95% N2). UQ: Ubiquinone; MQ-4: menaquinone.

