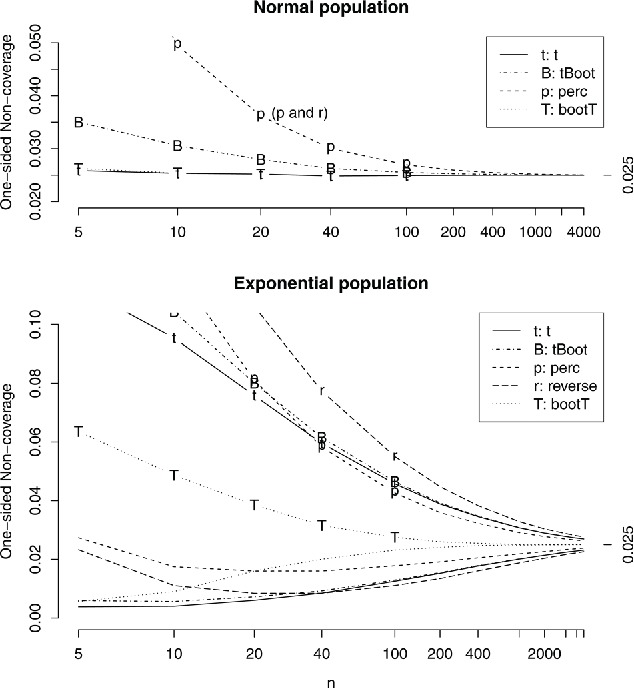
Figure 10 . Confidence interval one-sided miss probabilities for normal and exponential populations. 95% confidence interval, the ideal noncoverage is 2.5% on each side. The intervals are described at the beginning of Section 4.4. For the normal population noncoverage probabilities are the same on both sides, and the reverse percentile interval is omitted (it has the same coverage as the percentile interval). For the exponential population, curves with letters are noncoverage probabilities on the right, where the interval is below θ, and curves without letters correspond to the left side.