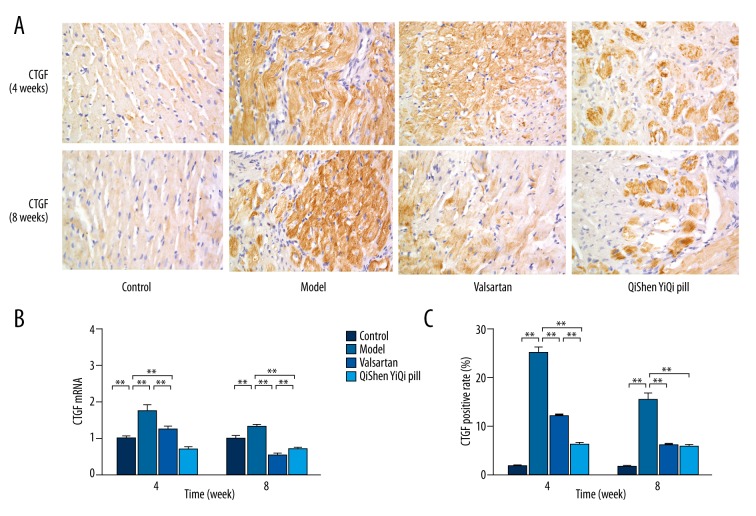
Figure 4.
Effects of QSYQ on the protein and mRNA expression of CTGF. (A) Representative photomicrograph of immunohistochemical staining of myocardium. (B) The CTGF mRNA expression for each group. (C) The CTGF positive area for each group. The percentage of immunohistochemical staining area was quantitavely analyzed by using Image-Pro Plus 6.0 (magnification, ×400). Data are expressed as mean ±SD. Groups: control (n=8), model (n=8), valsartan (n=8), QSYQ (n=8). Data are expressed as mean ±SD. * P<0.05, ** P<0.01.

