Figure 1.

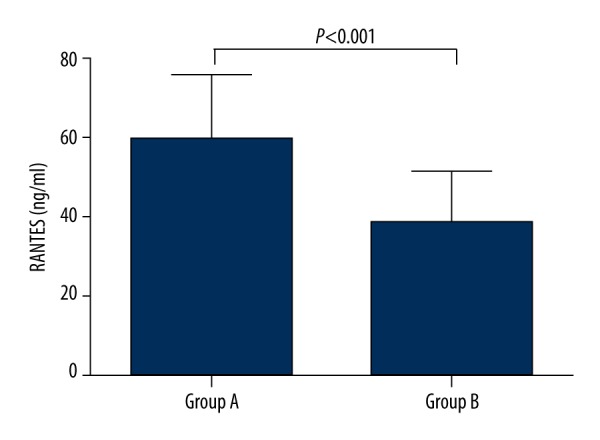
Baseline serum RANTES levels in the study participants. The values are expressed as the means±SD. Group A: type 2 diabetes patients with hypertriglyceridemia (n=25); Group B: control subjects (n=32).

Baseline serum RANTES levels in the study participants. The values are expressed as the means±SD. Group A: type 2 diabetes patients with hypertriglyceridemia (n=25); Group B: control subjects (n=32).