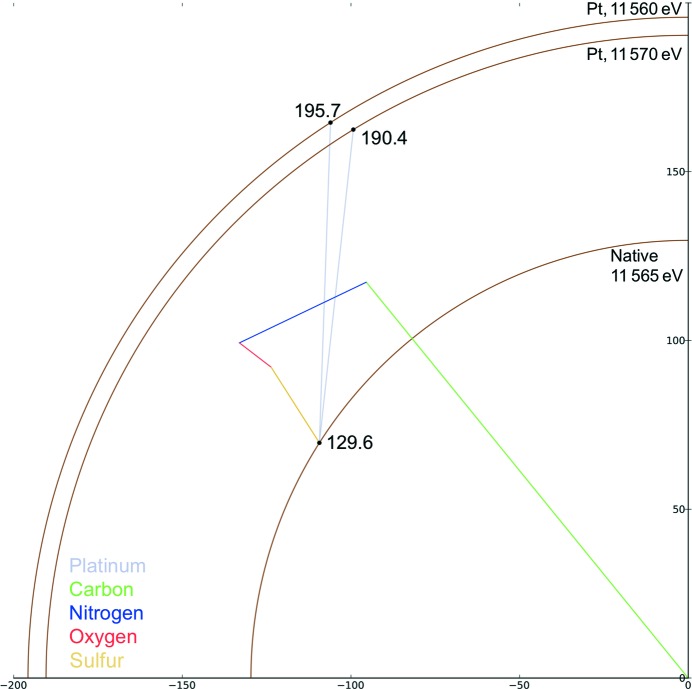
Figure 6.
Argand diagram showing the change of reflection (17, 7, 6) for the platinum derivative of FcγRIII above and below the Pt L III edge. The intensity increase with respect to the native is 128% (Pt derivative at 11.56 keV) and 116% (11.57 keV). The intensity change between the platinum derivatives above and below the L III edge is 5.7%.

