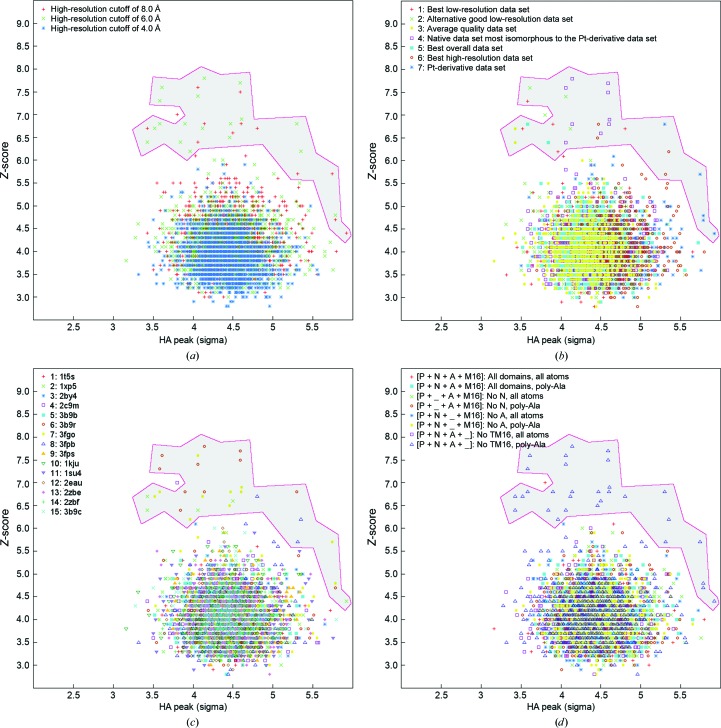
Figure 2.
Two-dimensional plot of the result of the MR parameter search. All solutions are plotted as a function of Z-score and corresponding highest difference peak in the Pt-derivative data set. The grey area highlights the MR solutions that turned out to be identical and correct. (a) High-resolution cutoff. (b) Data set used. (c) Scaffold used. The PDB code is noted. (d) Truncation and pruning used.

