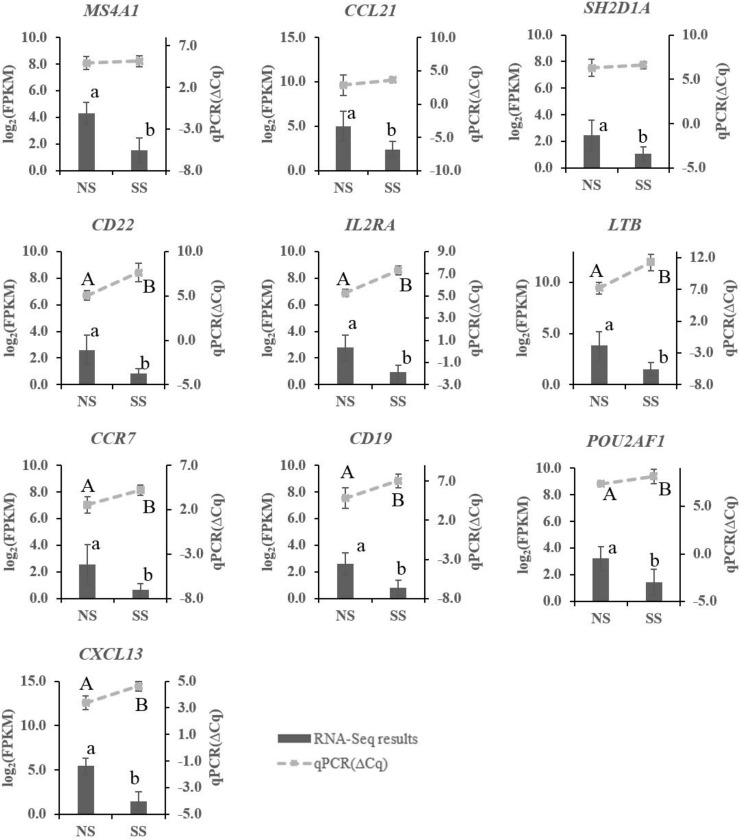
Fig 2. Expression of selected differentially expressed (DE) genes as detected by qRT-PCR and RNA-Sequencing.
Differentially expressed genes as measured by qPCR are shown by lines on the top and values are indicated by the right Y-axis as relative expression level (ΔCq). Lower ΔCt values represent higher gene expression levels and vice versa. Gene expression as measured by RNA-Seq are shown by bar graphs on the bottom and values are indicated by the left Y-axis as log2 (FPKM). A, B indicate a significant difference in the relative expression detected by qPCR (P-value < 0.05); a, b indicate a significant difference in expression of genes detected by RNA-Seq (FDR < 0.05). Data are presented as mean ± standard deviation. NS and SS represent non-shedders and super-shedders, respectively.

