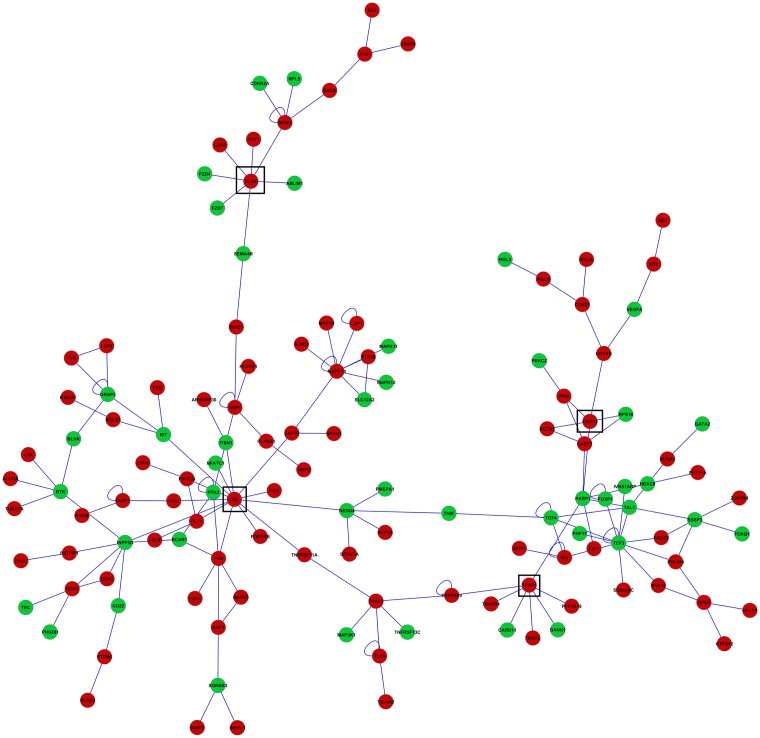
Fig 2. Network of genes differentially expressed between BCG-challenged and Control mice in macrophages.
Red (green) nodes denote genes over- (under-) expressed in BCG-challenged relative to Control mice. All genes were differentially expressed at FDR-adjusted P-value < 0.001. Edges denote known relationships between genes in the SysBiomics repository. Framed genes (squares) are discussed in the manuscript.

