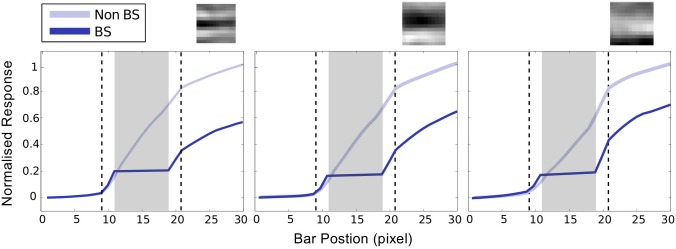
Fig 8. Response elevation in BS region at level 1.
Plots of the absolute value of normalized response are shown against the bar position for three highly active neurons (indicated by red arrows in the sixth bar blot of Fig 7) In these plots, dotted rectangular area indicates the extension of BS module whereas, the solid gray rectangular area indicates the extension of blind spot. The receptive fields of these three neurons are shown at the top of the respective plots, which show that these neurons participated in encoding information of a horizontal bar. To compare the relative activity of the neurons we have plotted the absolute value of the responses instead of signed values of responses.

