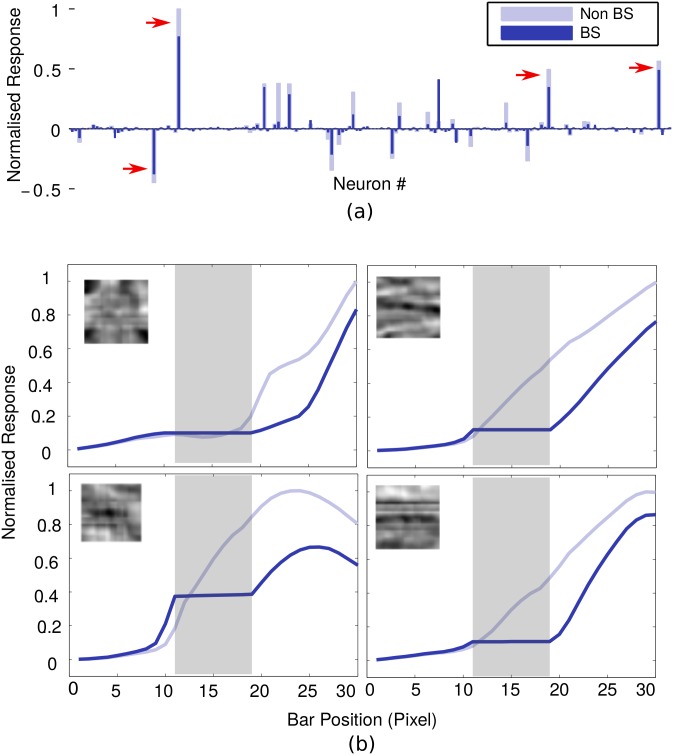
Fig 9. Response profile at level 2.
(a) The normalized response of 169 neurons at level 2 corresponding to shifting bar stimuli for the end postilion 6. (b) Plots of the normalized absolute value of response of most active neurons at level 2 (marked as red arrow in (a)). The receptive field of these neurons is shown in the inset of their corresponding plots.

