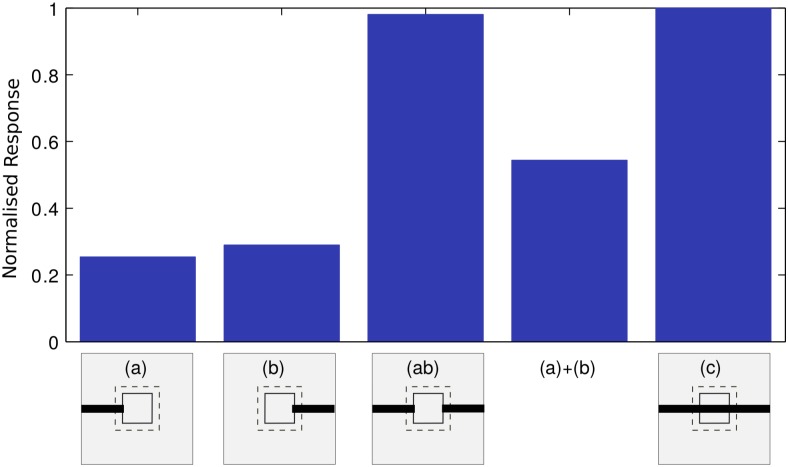
Fig 10. Nonlinearity in the response profile.
Average normalized responses of neurons (in BS module) to various stimulus conditions are presented. Estimated responses to stimuli a, b, c and ab, as well as the sum of the responses to a and b are shown, where ab is a combination of stimuli a and b. Each stimulus is schematically shown below each bar plot, where each bar plot shows the mean of normalized responses of 8 most responsive neurons in the BS module. Conventions are same as shown in Fig 8.

