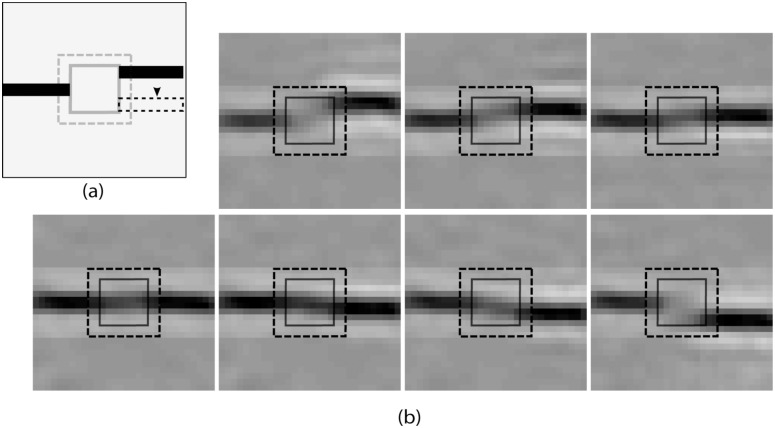
Fig 11. Nonaligned bar investigation.
a) A typical stimulus is shown, where two non-aligned bar segments are presented at opposite sides of the blind spot. For our study, one bar was fixed (left one) and the other one was shifted vertically by one pixel per instant for the seven positions emulating seven stimuli. b) The generated “perceptual images” for those stimuli (as discussed in (a)) corresponding to the recorded response profile of PE neurons at level 1.

