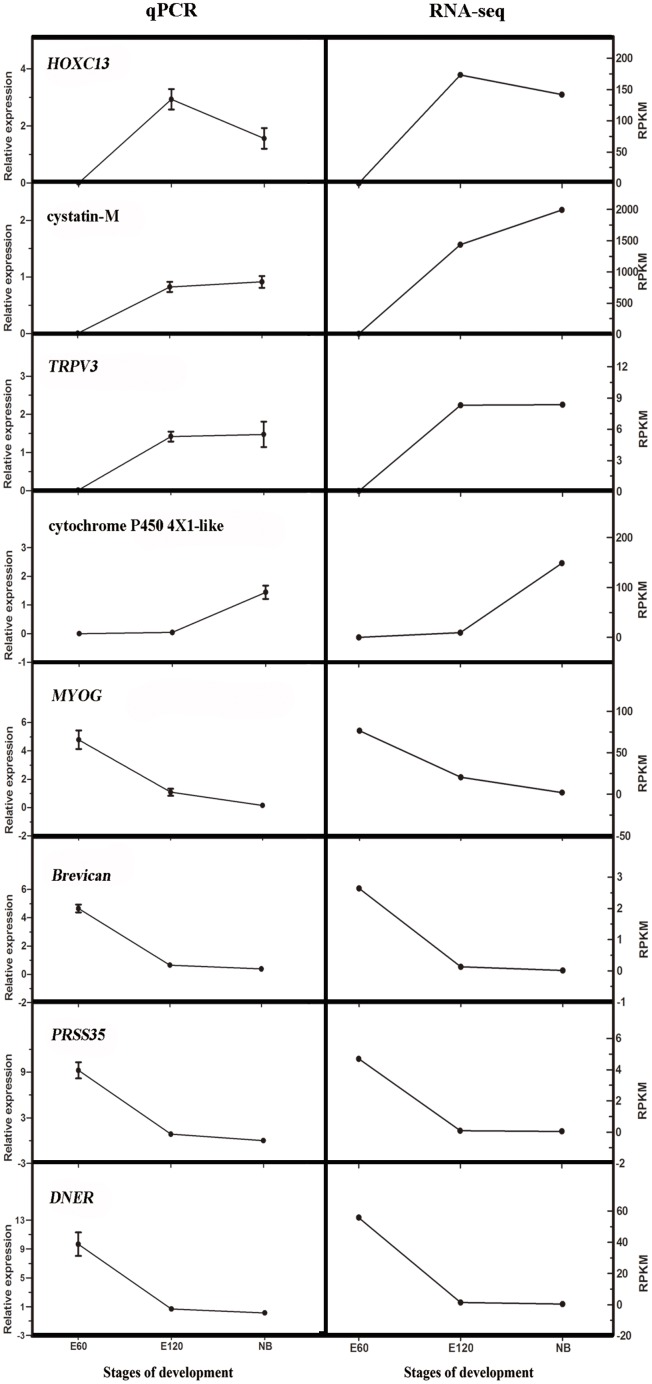
Fig 2. Expression levels of tested reference genes revealed by qPCR and RNA-seq.
Data from qPCR are shown as means ± standard error (SE) of three replicates. RPKM from RNA-seq are shown as means and SE of three replicates. The left side indicates the data from qPCR; the right side shows RPKM from RNA-seq.

