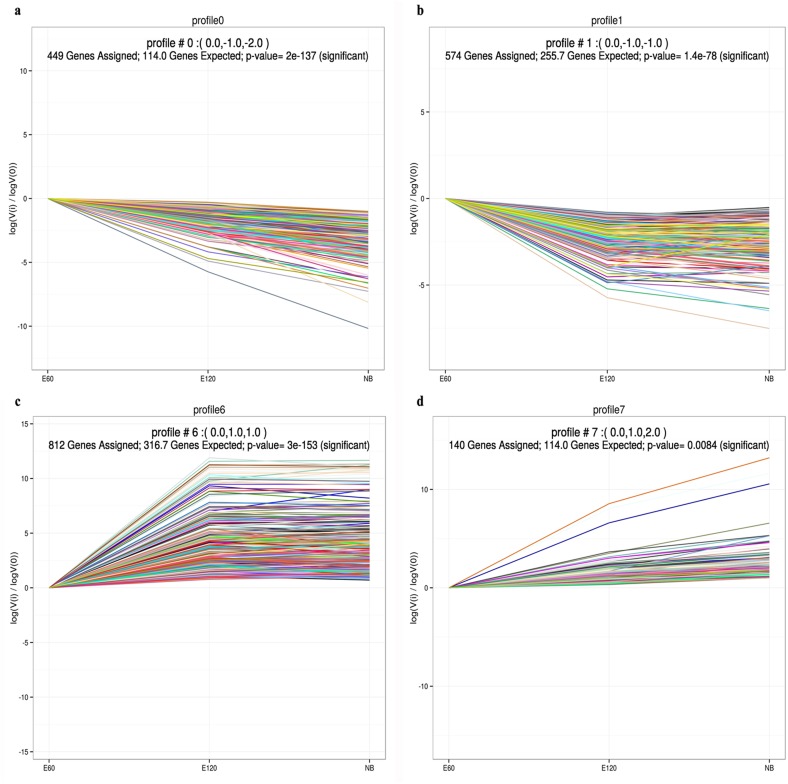
Fig 5. Cluster trajectory profiles across stages of HF development.
Profiles a-d: Each X-axis indicates the HF development state (E60, E120, and NB); The Y-axis shows expression changes. Trajectory cluster analyses (see Methods) show that gene expression did not steadily increase or decrease in the progression. Four profiles (profiles a-d) represent the major transcriptional trajectories.

