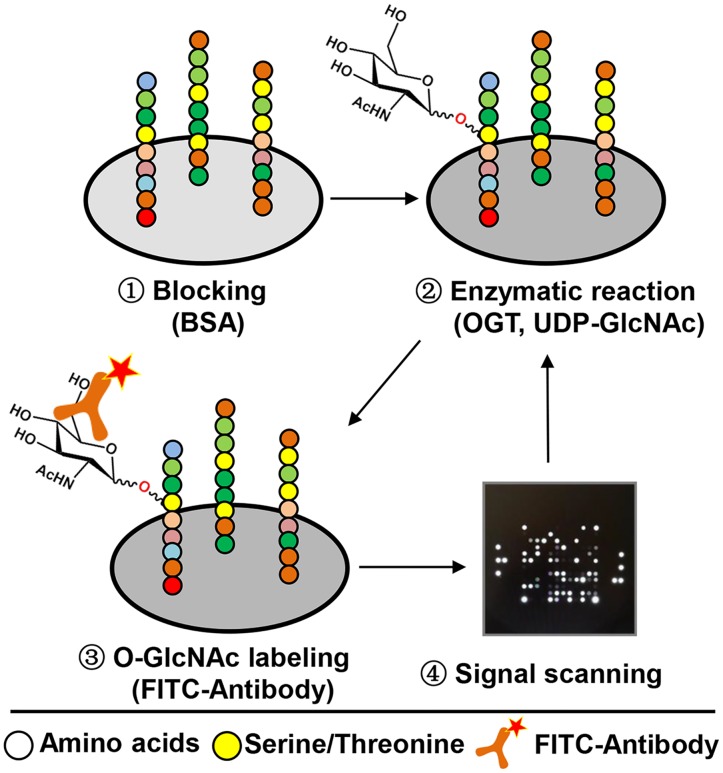
Fig 1. The schematic depiction of the peptide microarray process for discovering OGT substrates.
The microarray was blocked with BSA, and followed by the addition of OGT (s-OGT, m-OGT, and nc-OGT), UDP-GlcNAc, and a FITC conjugated antibody. The enzymatic reaction was run by pumping the mixture up and down through the porous Al2O3 chip material. Images of the fluorescent signals were generated every 10 minutes during 4 hours (kinetic readout). Images were quantified using Bionavigator 6 software.

