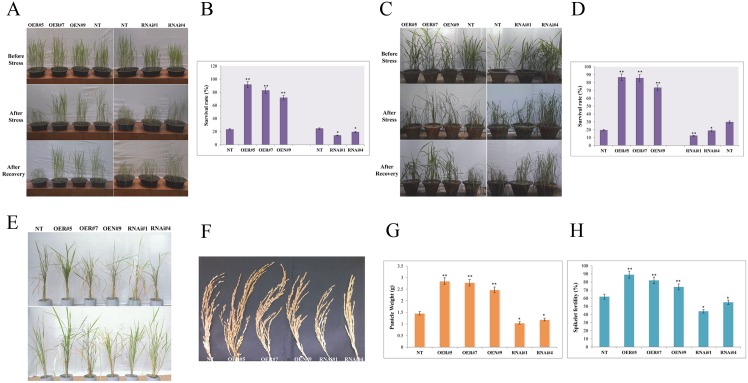
Fig 6. Assessing drought stress tolerance and grain yield of OsbZIP23 overexpression (OE) and down-regulated (RNAi) transgenic lines.
(A) Photographs of OE lines, RNAi lines and non-transgenic (NT) plants in the vegetative stage- before and after drought stress and their subsequent recovery after the drought treatment. (B) Survival rates of transgenic lines and NT plants, calculated in percentage (%). (C) Photographs of OE lines, RNAi lines and NT plants in early reproductive (panicle initiation) stage- before and after drought stress and their subsequent recovery after the drought treatment. (D) Survival rates of transgenic lines and NT plants, calculated in %. (E) Drought stress in PVC pipes in flowering stage and subsequent recovery till seed maturation stage of OE lines, RNAi lines and NT plants. (F) Mature panicle of OE lines, RNAi lines and NT plant. (G) Measurement of panicle weight in OE lines, RNAi lines and NT plant. (H) Spikelet fertility measurement in OE lines, RNAi lines and NT plants, calculated in %. Data bars represent the mean ±SD of triplicate measurement. Statistical analysis by Student’s t-test indicated significant differences (*P<0.05, ** P<0.01). All the results were based on three independent experiments.

