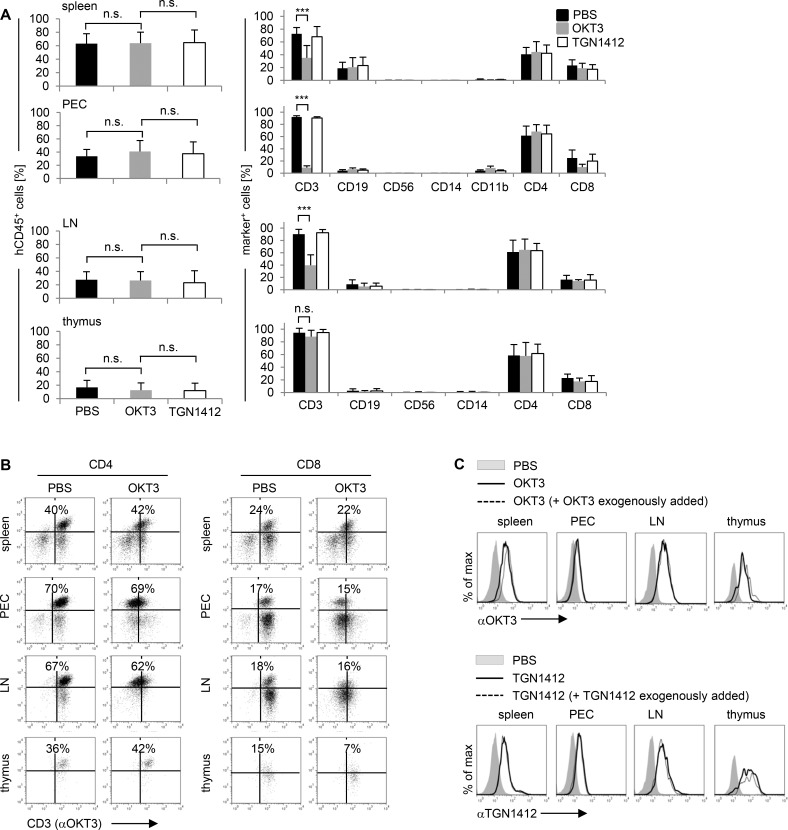
Fig 3. OKT3 application selectively downmodulates CD3 on T cells in humanized mice.
Humanized mice were injected i.v. with 20 μg OKT3 or 20 μg TGN1412 per 10 grams body weight. (A) 2–6 hours (time point of sacrifice) post OKT3 (gray bars; n = 6–16) or TGN1412 (white bars; n = 6–16) application, percentage and composition of hCD45+ cells in spleen, PEC, LN, and thymus of humanized mice were analyzed by flow cytometry. PBS-treated mice (black bars; n = 6–16) were used as control. *** p < 0.001; n.s., not significant (t-test, for comparison of hCD45+ cells adjusted according Dunnett for multiple comparisons). (B) 4 hours post OKT3 (n = 3) application, CD3 expression on hCD4+ or hCD8+ T cells in spleen, PEC, LN, and thymus of humanized mice was analyzed by flow cytometry. PBS-treated mice (n = 3) were used as control to adjust quadrants for definition of positive and negative cells. Data from one individual animal, being representative for the indicated groups, are shown. (C) 4 hours post OKT3 (n = 3) or TGN1412 (n = 3) application, mAbs bound by their target CD3 or CD28 on human CD4+/CD8+ T cells in spleen, PEC, LN, and thymus of humanized mice were analyzed by flow cytometry (black curves). In vivo receptor occupancy of CD3 or CD28 was analyzed by exogenously adding OKT3 or TGN1412 to cells isolated from spleen, PEC, LN, and thymus of in vivo mAb-treated humanized mice (dotted curve). PBS-treated mice (n = 3) were used as control (gray-shaded curves). Data from one individual animal, being representative for the indicated groups, are shown. Data shown in (A) are taken from 2–6 independent experiments. Data shown in (B) and (C) are representative for 2 independent experiments.

