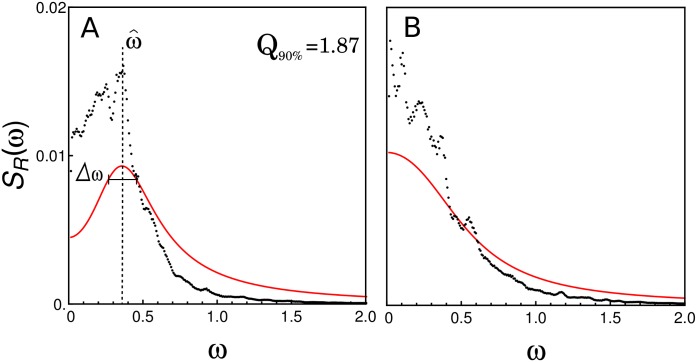
Fig 3. Power spectral densities.
Normalized power spectral density of the fluctuations of repressor obtained by averaging 8000 periodograms from stochastic simulations of Fig 2 (black dots), and the approximate normalized power spectral density computed by using Eq (4) (red curve). indicates the peak frequency, and Δω is the difference of the two frequencies at which the power takes the 90% of the peak value. The frequency ω is given in radians per minute (rad min−1).

