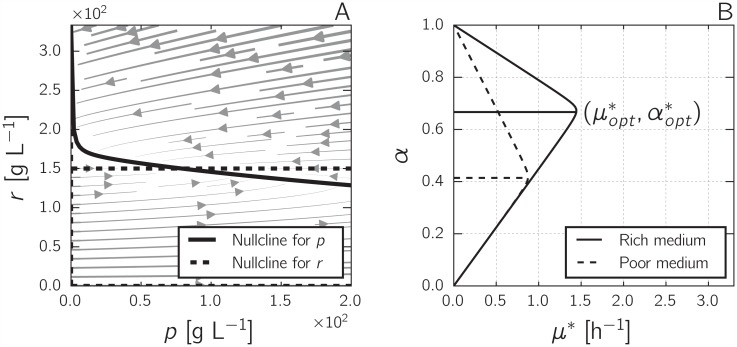
Fig 2. Analysis of self-replicator model of bacterial growth.
A: Phase-plane analysis of the self-replicator model of Eqs 3 and 4. The nullclines for p and r are shown as solid and dashed curves, respectively. Parameter values are eM = 3.6 h-1, kR = 3.6 h-1, KR = 1 g L-1, β = 0.003 L g-1, α = 0.45. B: Dependence of the growth rate at steady state μ* on the resource allocation parameter α, for two different environmental conditions (solid line, eM = 4.76 h-1; dashed line, eM = 1.57 h-1, other parameter values are kR = 2.23 h-1, KR = 1 g L-1, and β = 0.003 L g-1). The maximal growth rate is attained for a unique α, called .

