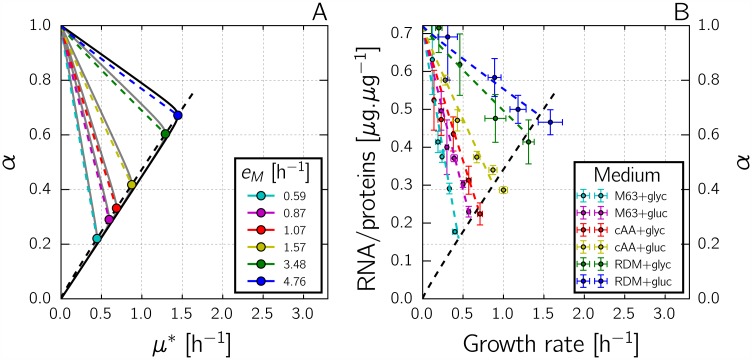
Fig 3. Self-replicator model accounts for bacterial growth laws.
A: Predicted quasi-linear relation between the maximal growth rate and the corresponding optimal resource allocation , for different values of eM (different colors). The colored dots indicate and for kR = 2.23 h-1 and different eM, and the dashed black line the relation for all intermediate values of eM. The dashed colored lines indicate the relation between and obtained when, for a given value of eM, the value of kR is decreased (lower kR leads to lower ). The solid grey curves correspond to (μ*, α)-profiles like those shown in Fig 2B. B: Measured relation between the total RNA/protein mass ratio and the growth rate, in different growth media with different doses of a translation inhibitor (data from [12]). For each medium, indicated by a color, five different concentrations of inhibitor were used (higher dose leads to lower growth rate). Growth-medium compositions are given in the original publication and error bars represent standard deviations. The dashed black and colored lines are the same as in panel A, indicating the good quantitative correspondence between model predictions and experimental data for the chosen parameter values, obtained by fitting the model to the data points (see Methods for details).

