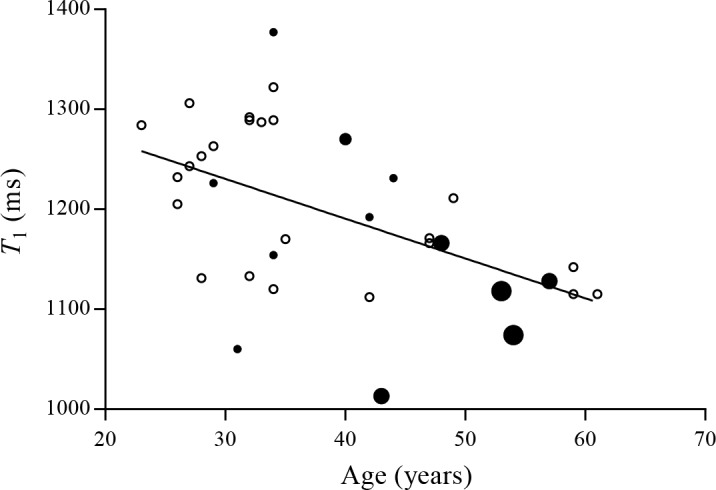
Fig 2. Lung T1 as a function of age and PY for all subjects.

The example line shows the correlation between median lung T1 and age for smokers (●) and never smokers (○), indicating that lung T1 shortens with ageing (p<0.01, r = -0.52). The smoking history of the current smokers is visualized with increased size of the dots ( = 1–10 PY, = 11–20 PY, = 21–30 PY and = 31–40 PY).
