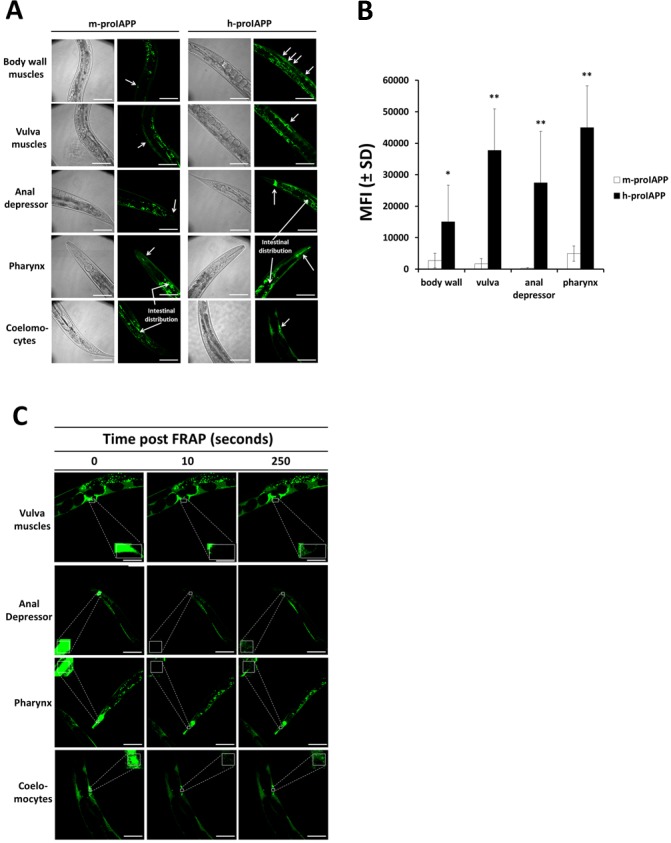
Fig 4. Expression of h-proIAPP in C. elegans results in protein insolubility and aggregation.
Transgenic h-proIAPP C. elegans model was generated by gonad microinjection of 20 ng/μl of plasmids pPR3, pPR4 and pPR5. Transgenic m-proIAPP C. elegans model was generated by gonad microinjection of 20 ng/μl of plasmids pPR8, pPR9 and pPR10. A. h-proIAPP and m-proIAPP tagged with YFP were expressed in body wall muscles, vulva muscles and anal depressor muscles under lev-11 promoter; in pharynx under tnt-4 promoter, and in neurons under aex-3 promoter. Neuronal expression of proIAPP secreted into the body cavity was observed in the coelomocytes of the h-proIAPP model and distributed in the intestinal region in both h-proIAPP and m-proIAPP C. elegans models. Images were created using maximum intensity projections on all the planes of the acquired stacks except coelomocytes where images were taken in a single plane for better visualization. Arrows indicate areas of fluorescence. DIC images were taken to visualize structures. Results are a representative experiment from at least three independently performed experiments with similar results. Scale bars represent 50 μm. B. Data represent the mean fluorescence intensity (MFI) ± SD measured using a sum intensity projection on all the planes of the acquired stacks of m-proIAPP (open bars) and h-proIAPP (filled bars) tagged with YFP expressed in body wall muscles, vulva muscles, anal depressor muscles and pharynx. *p<0.05; **p<0.01 versus m-proIAPP. C. Transgenic h-proIAPP C. elegans tagged with YFP were subjected to FRAP analysis (square). Data are from vulva muscles (row 1), anal depressor (row 2), pharynx (row 3) and coelomocytes (row 4) before FRAP (left panels), 10 seconds after FRAP (middle panels) 250 seconds after FRAP (right panels). Images were obtained using an inverted confocal microscope. Results are representative experiment from at least three independently performed experiments with similar results. Scale bars represent 50 μm.

