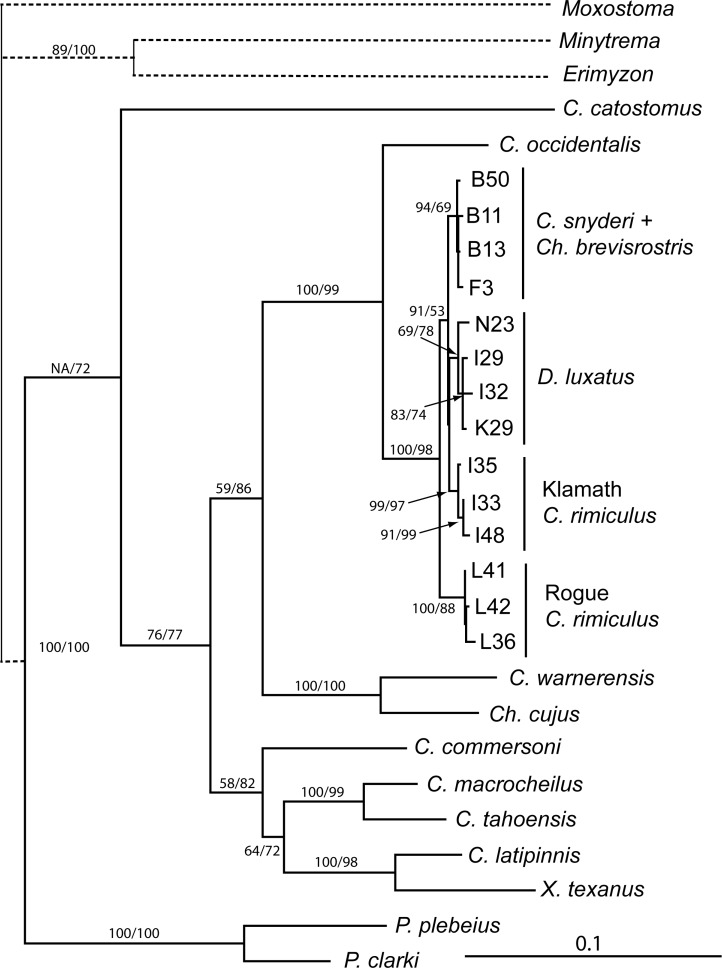
Fig 6. Maximum likelihood tree generated from complete sequences of ND4L, ND2, and cytb genes for a diversity of catostomid fishes.
Haplotype labels as in S2 Table. Solid branches are drawn to scale; dashed branches have been truncated to better show details of the ingroup. Numbers near nodes represent bootstrap support (%) for MP and ML analyses, respectively. Values are provided only where one of the values was >70%. NA identifies an inconsistency between MP and ML trees.

