Figure 2.
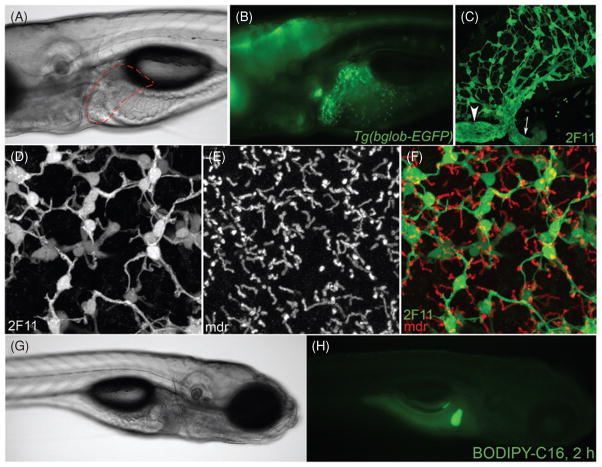
Overview of zebrafish biliary development and function. (A) Brightfield high-magnification image of a live 5 dpfTg(bglob-EGFP)larva, raised in 1-phenyl-2-thiourea (PTU) to inhibit melanophore development. Liver (red dashed line) is anterior to intestinal bulb and swim bladder. (B) The same larva imaged by whole-mount fluorescence microscopy. Developing biliary cells in the liver express the Notch-responsive reporter gene encoding EGFP. (C) Confocal projection of fixed wild-type liver, stained with monoclonal antibody 2F11 to visualize biliary tree, including gallbladder (arrowhead) and extrahepatic bile duct (arrow). (D–F) High-magnification confocal projection through the liver of a 5 dpf wild-type larvae immunstained with the 2F11 antibody showing the relationship between bile ducts (labeled by 2F11) and canaliculi (labeled by anti-Mdr antibody). (G) Brightfield image of live 5 dpf wild-type larva in right lateral view, showing right liver lobe, gallbladder, and pancreas. (H) Whole-mount fluorescent image of the same larva, two hours following application of BODIPY-FL C16 to the aqueous media. Fluorescent lipid is secreted into bile and accumulated in the gallbladder.

