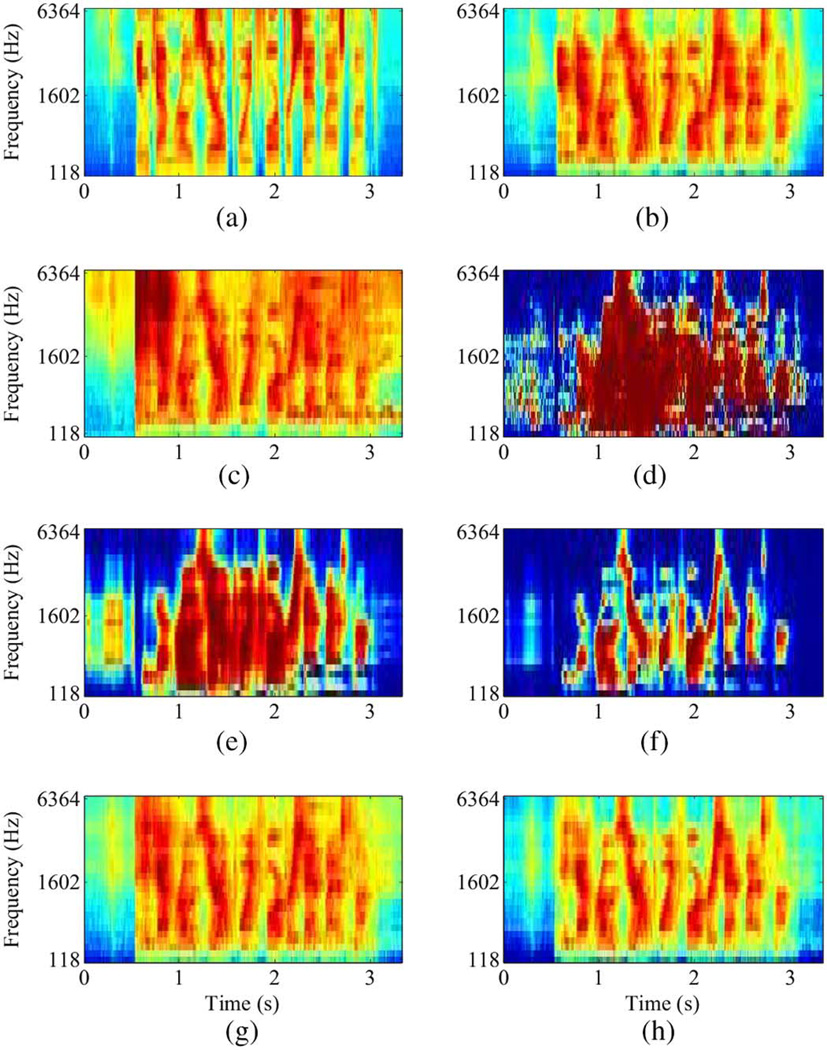
Fig. 2.
Example of masking: (a) Log-mel spectrogram of a clean utterance. (b) Log-mel spectrogram of the utterance with reverberation. (c) Log-mel spectrogram of the utterance with noise and reverberation. The SNR, with respect to reverberant speech, is −3 dB. (d) The ideal ratio mask. (e) The IRM estimated by the independently trained mask estimator. (f) The IRM estimated by the joint model. (g) The noisy log-mel spectrogram enhanced using the estimated IRM. (h) The noisy log-mel spectrogram enhanced using the IRM estimated by the joint model.

