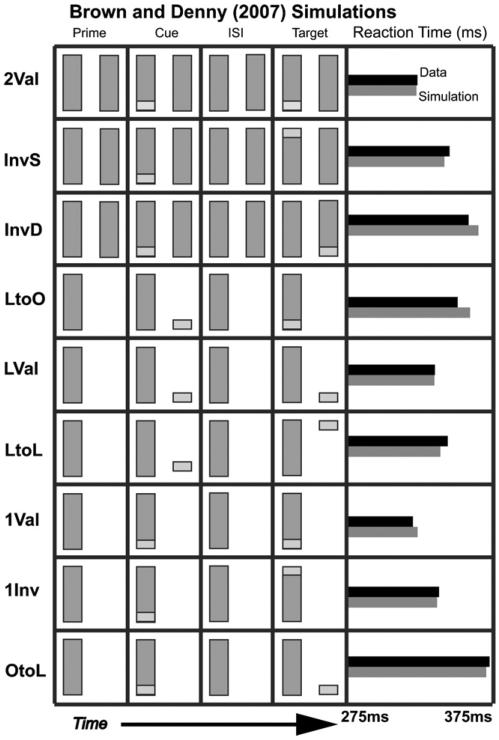
Fig. 3.
Brown and Denney (2007) data and reaction time (RT) simulations. Each experimental case is shown, with the four columns corresponding to what is seen in each display segment. Experimental RTs (black) and simulated RTs (gray) are shown at the far right. [Data reprinted with permission from Brown and Denney (2007).]

