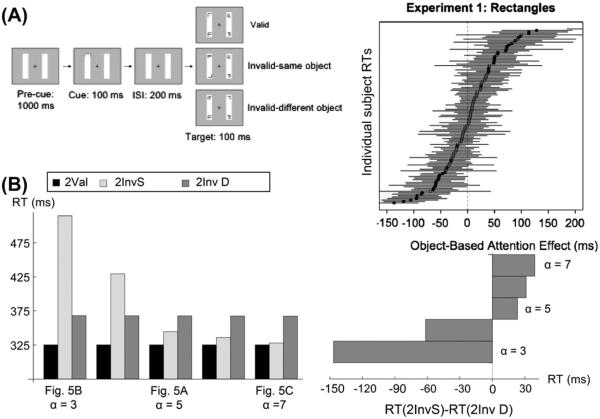
Fig. 6.
Roggeveen et al. (2009) individual difference data and modeled behavior. (A) The experimental paradigm and individual preferences for InvS, and InvD targets. (B) Simulated reaction times for two-object conditions (left plot), and reaction time differences (right plot) between InvS and InvD conditions, as the (spatial shroud)-(object shroud) resonance changes from weakest (left, α = 3, Eq. (33)) to strongest (right, α = 7, Eq. (33)) by increasing the response gain to changing inputs in the object shroud layer. This shifts preference from InvD (bottom) to InvS (top). [Data reprinted with permission from Roggeveen et al. (2009).]

