
Fig. 5.
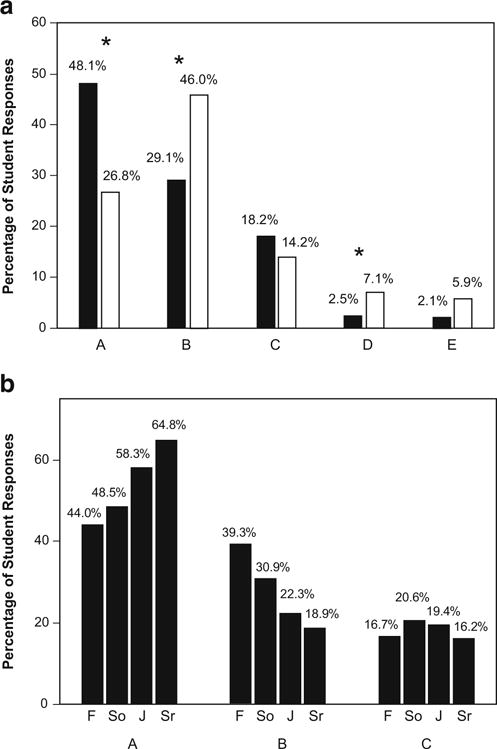
a Percentage of biology majors (black bars, n=237) and nonmajors (white bars, n=239) who consider one of the following statements describes them best: A = I accept evolution and express it openly regardless of other’s opinions, B = no opinion, C = I accept evolution but do not discuss it openly to avoid conflicts with friends and family, D = I believe in creationism and express it openly regardless of others’ opinions, and E = I believe in creationism but do not discuss it openly to avoid conflicts with friends and family. Raw data chi-square=34.573, df=4, P≤0.001; asterisks indicate Sign test two-tail pair-wise comparisons P≤0.04. b Percentage of freshman (F), sophomore (So), junior (J), and senior (Sr) biology majors who consider statements A, B, or C (above) describes them best (D and E were excluded from the analysis because over 20% of their expected values were less than 5). Chi-square of percentage values=14.535, df=6, P value=0.024