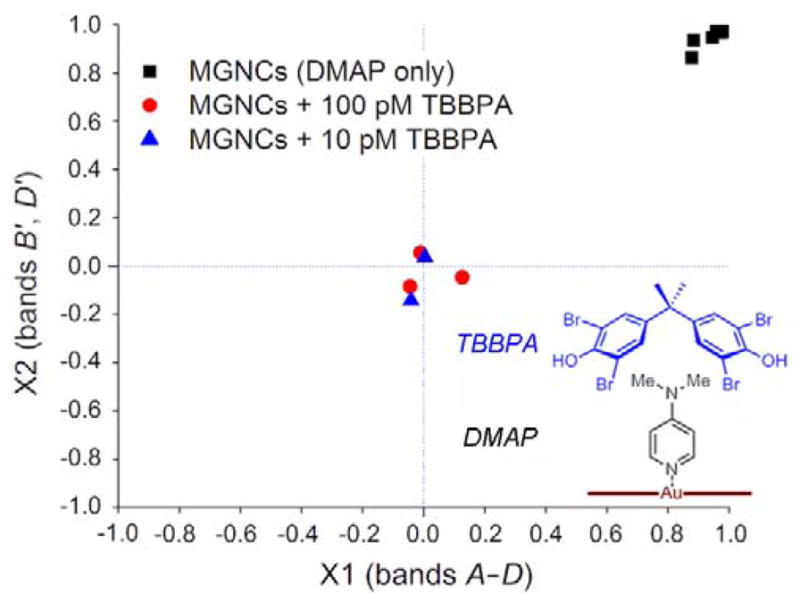
Figure 6.

Two-dimensional correlation plot for DMAP-modified MGNCs treated with water (black squares, N=44), 100 pM TBBPA (red circles, N=42), or 10 pM TBBPA (blue triangles, N=11). The low number of unique points in the scatter plot reflects a high degree of reproducibility in the acquisition of SERS data.
