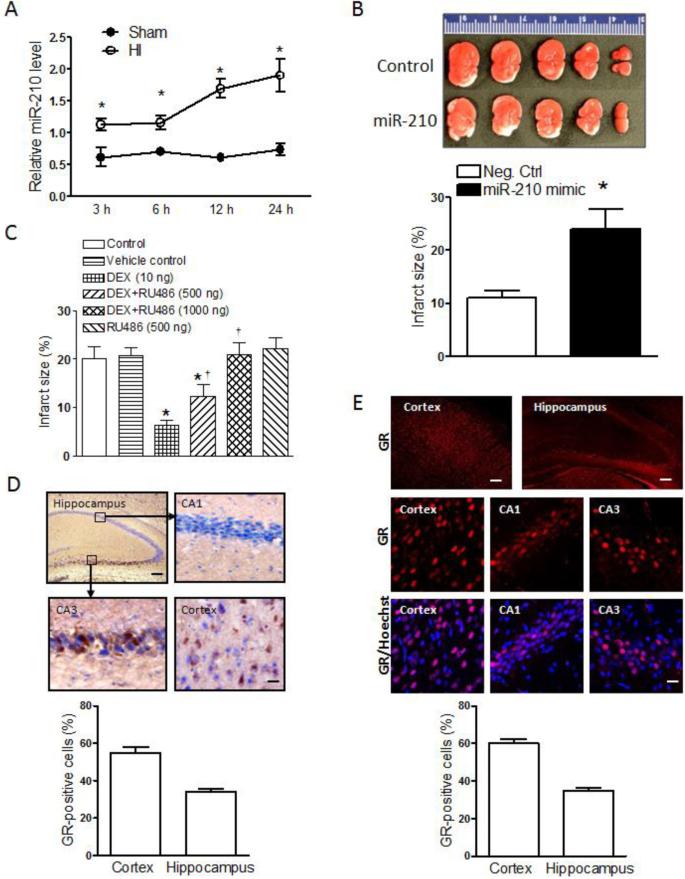
Figure 1. Role of miR-210 and GR in neonatal HI brain injury.
(A) MiR-210 levels in the ipsilateral hemisphere in HI and Sham rat pups. n=4. * P<0.05, HI vs. Sham. (B) Pups received the miR-210 mimic or negative control (Neg. Ctrl) via i.c.v. 48 hours prior to the HI treatment (1.5 hours of hypoxia, 8% O2), and brain infarct size was determined 48 hours after HI. n=8. * P<0.05, miR-210 mimic vs. Neg. Ctrl. (C) Pups received the vehicle control, DEX, RU486, or DEX+RU486 via i.c.v. 24 hours prior to the HI treatment, and brain infarct size was determined 48 hours after HI treatment. n=6-7. * P<0.05, DEX or DEX+RU486 vs. control; † P<0.05 DEX+RU486 vs. DEX alone. (D) Representive immunohistochemical images and quantification of GR-positive cells (nine images per region, 3 sections/pup; n=4) in the cortex and hippocampus. Up-left, Scale bar = 100 μm; Others, Scale bar = 20 μm. (E) Representive immunofluorescence images and quantification of GR-positive cells (nine images per region, 3 sections/pup; n=4) in the cortex and hippocampus of rat pups. Up, Scale bar = 100 μm; Others, Scale bar = 20 μm.

