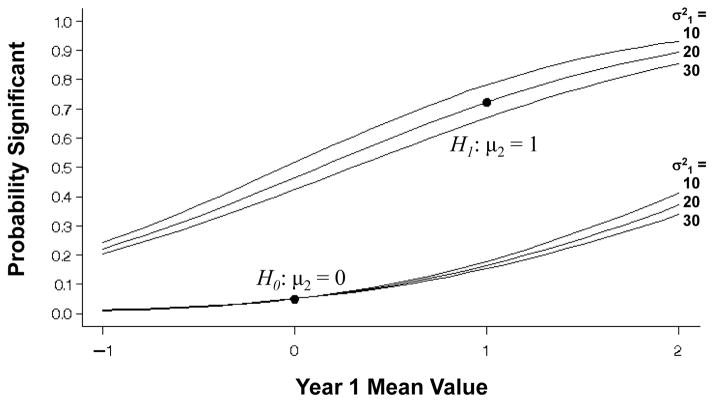
Figure 3.
One-sided probabilities of significance for a one-sample test of the change from baseline at 2-years under the null and the alternative hypotheses (μ2 = 0 or 1, respectively), with variance , for a single sample of n = 100 with 30% missing that are replaced by values at 1-year with mean μ1 ranging from −1 to 2 and variance , 20, 30. The correct probabilities with no missing data are designated by the dots.

