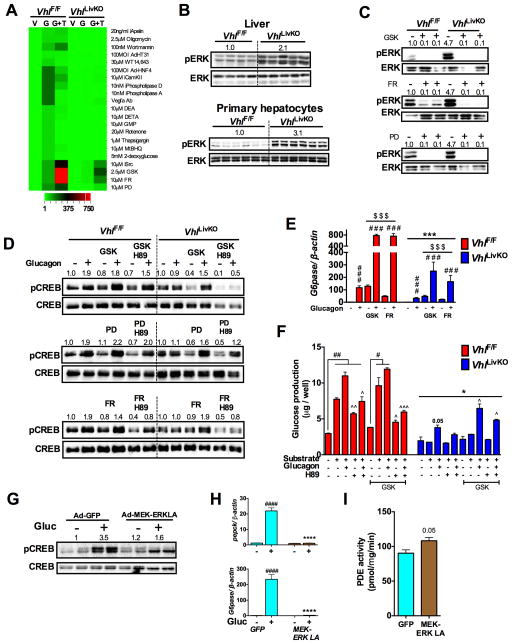
Figure 6. HIF2α induced ERK activity represses hepatic glucagon signaling.
(A) qPCR analysis of G6pase in PH pre-treated with inhibitors or activators for two-hours and then with glucagon for additional 2-hours (V-Veh; G- Glucagon; G+T- Glucagon + treatments). (B and C) pERK levels assessed in livers and PH of VhlLivKO mice. pERK levels, (D) Glucagon induced pCREB and (E) qPCR analysis of G6pase mRNA in PH pre-treated with 2.5 μM GSK1120212 and 10 μM PD98059 and10 μMFR180204 for 16-hours. Each bar represents the mean value ± S.E.M. ***p < 0.001 compared to VhlF/F. ###p < 0.001 compared to no glucagon. $p < 0.05, $$$p < 0.001 compared to without inhibitor treatment. (F) Glucose production in PH pre-treated with GSK for 16-hours. Each bar represents the mean value ± S.E.M. ##p < 0.001 compared to no substrate or glucagon. ^p < 0.05, ^^p <0.01 compared to substrate and glucagon treated, *p <0.05 compared to VhlF/F $p < 0.05, $$$p < 0.001 compared to without inhibitor treatment. Glucagon stimulated (G) pCREB and (H) Pepck and G6pase mRNA expression in WT PH infected with Ad-GFP or Ad-MEK-ERK-LA virus for 48-hours. ***p < 0.001 compared to Ad-GFP. ####p < 0.001 compared to no glucagon. (I) PDE activity in PH infected with Ad-GFP or Ad-MEK-ERK-LA virus for 48-hours. Five to six mice were used per group and experiments with PH were done in triplicates and repeated at least twice.

