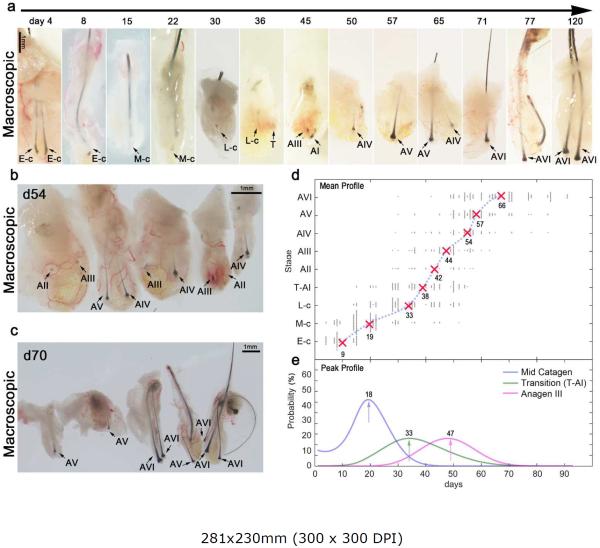
Figure 5. Xenograft model optimization.
(a) Representative gross morphology of human HFs-XG showing post-grafted hair cycle resetting dynamics: follicles progress through sequential catagen sub-stages, telogen-to-anagen transition stage, and then anagen sub-stages. (b, c) Representative images showing hair cycle heterogeneity of HFs-XG at day 54 (b) and 70 (c). (d) Comprehensive hair cycle staging of human HFs-XG during the first 90 days (x-axis). Average time point values for each sub-stage (y-axis) are shown with the average regression curve overlaid over the scatter plot of individual HFs stage values (assessed upon biopsy; each dot represents one biopsied HF). (e) Statistical analysis of the frequency at which the indicated stage appears (early catagen, telogen-to-anagen I transition, and anagen III). Arrows denote the post-grafting time with the greatest probability of selecting HFs-XG at the indicated stage based on the Naïve Bayes classifier analysis. Further details (for every hair cycle sub-stage) can be found on Supplementary Figure S5.
Hosts: SCID mice (panels – a (days 15, 22, 50, 57, 65) and c), nude mice (panels – a (days 4, 8, 30, 36, 45, 71, 77, 120) and b).
Scale bars: a, b, c – 1mm.

