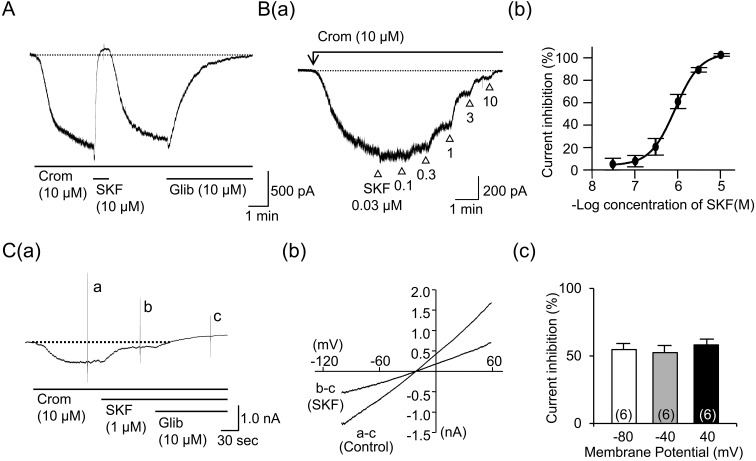
Fig. 2.
Effects of SKF96365 (SKF) on cromakalim-induced IKATP. IKATP was induced by cromakalim (10 µM) in the cells under the same condition as those mentioned in Fig. 1. A shows a typical current trace when SKF (10 µM) was extracellularly applied to the cell in the presence of cromakalim (10 µM). B shows a relationship between concentration of SKF and its inhibitory effect on IKATP. (a): a typical example of the IKATP suppression induced by cumulative application of SKF (0.03-10 µM). (b): the averaged concentration-inhibition curve of IKATP. Each point indicates the mean ± S.E.M. of measurements in 6 cells. C shows a voltage sensitivity of the SKF-induced IKATP suppression. (a): a typical example of IKATP suppression induced by SKF (1 µM), where a voltage ramp pulse from −100 mV up to +60 mV over 350 msec was applied in the presence of cromakalim (10 µM) alone (current a), cromakalim + SKF (1 µM) (current b) and those agents together with glibenclamide (10 µM) (current c). (b): the I-V curves constructed by subtraction of the current c from the current a or b. (c): the mean percentage of IKATP suppression at each holding potential. Each column indicates mean + 1 S.E.M. The numbers of cells used are presented in parenthesis.

