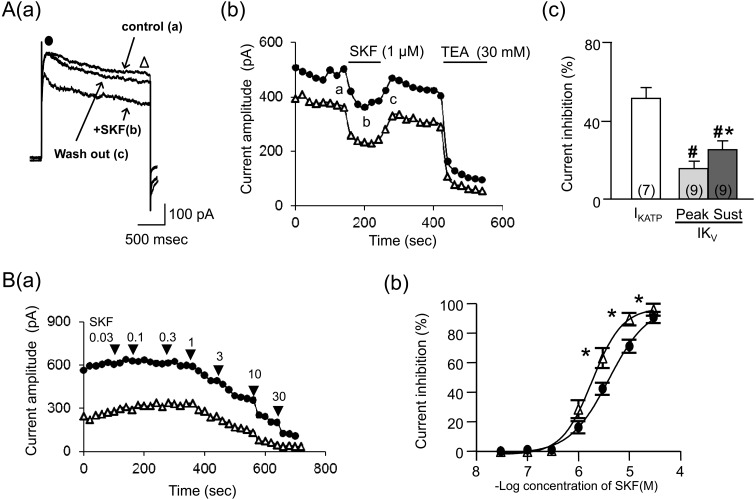
Fig. 4.
Effects of SKF on voltage-gated K+ channel currents (IKv). Cells bathed in the Ca2+-free PSS were held under voltage clamp at −80 mV using patch pipettes filled with the K+-rich high-BAPTA pipette solution. A 2 sec step pulse to 20 mV was repeatedly applied every 20 sec in order to elicit IKv. Aa: IKVpeak (●) and IKVsustained (Δ) recorded in a cell when SKF (1 µM) was extracellularly applied. Ab: time courses of the change in IKVpeak (●) and IKVsustained (Δ) in the cell in a plotted against time (the beginning of depolarizing pulse applications was taken as zero) when SKF (1 µM) was extracellularly applied. Points a-c in the graph correspond with actual IKv records (a–c) in Aa. Ac shows the mean percentages of IKATP and IKv suppressions induced by SKF (1 µM). Each column indicates mean + 1 S.E.M. The numbers of cells used are presented in parenthesis. B (a): time courses of the change in IKVpeak (●) and IKVsustained (Δ) when SKF (0.03-30 µM) was cumulatively applied. Bb: the averaged concentration-inhibition curves of IKVpeak (●) and IKVsustained (Δ). Each point in Bb indicates the mean ± S.E.M. of measurements in 3–5 cells. # in (Ac) represents significantly smaller inhibition of IKv induced by SKF (1 µM) relative to the IKATP one (P<0.05). Asterisks in (Ac) and (Bb) represent significantly greater inhibition of the IKVsustained relative to the IKVpeak (P<0.05).

